


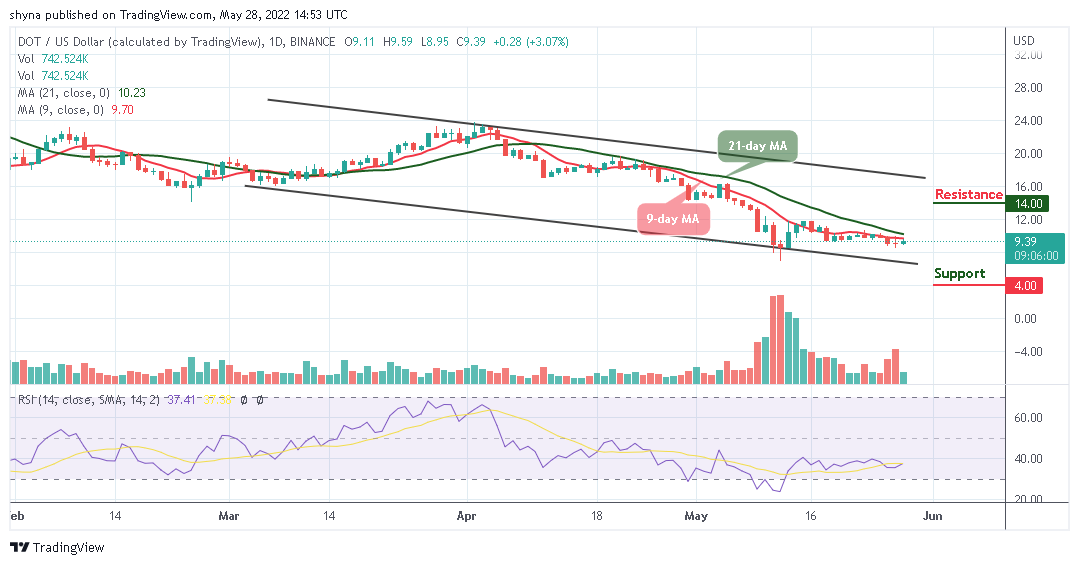
The Polkadot price prediction shows that DOT is trading near the resistance level of $10 below the 9-day and 21-day moving averages.
Polka Dot Prediction Statistics Data:
- Polkadot price now – $9.39
- Polkadot market cap – $9.3 billion
- Polkadot circulating supply – 987.5 million
- Polkadot total supply – 1.1 billion
- Polkadot Coinmarketcap ranking – #11
USD/DOT Market
Key levels:
Resistance levels: $14, $15, $16
Support levels: $4, $3, $2
After touching the resistance level of $9.59 today, DOT/USD is trading at $9.39. The coin is moving within the channel and below the 9-day and 21-day moving averages, indicating an indecisive movement in the market. For the time being, the market price is moving towards the resistance level of $10 as the trading volume is issuing a buy signal, while the technical indicator confirms the sideways movement.
Polkadot Price Prediction: DOT Price May Not Be Ready for The Upside
At the time of writing, the Polkadot price is still at the downside as bulls couldn’t push the coin to the upside. However, any attempt by the buyers to cancel the current bearish movement and push the Polkadot price above the 9-day and 21-day moving averages are likely to revisit the resistance level of $10.
However, any bullish movement above this level could lead the market to the crucial resistance levels at $14, $15, and $16. On the contrary, if the coin heads towards the lower boundary of the channel, the DOT price could reach the critical supports at $4, $3, and $2 as the technical indicator Relative Strength Index (14) stays below the 40-level.
DOT/BTC Market: Consolidating to the Downside
Against Bitcoin, the Polkadot is trading with a bullish candle below the 9-day and 21-day moving averages. The technical indicator Relative Strength Index (14) is moving to cross above the $50-level which could bring more bullish signals into the market. A further bullish movement may likely hit the resistance level of 4000 SAT and above.
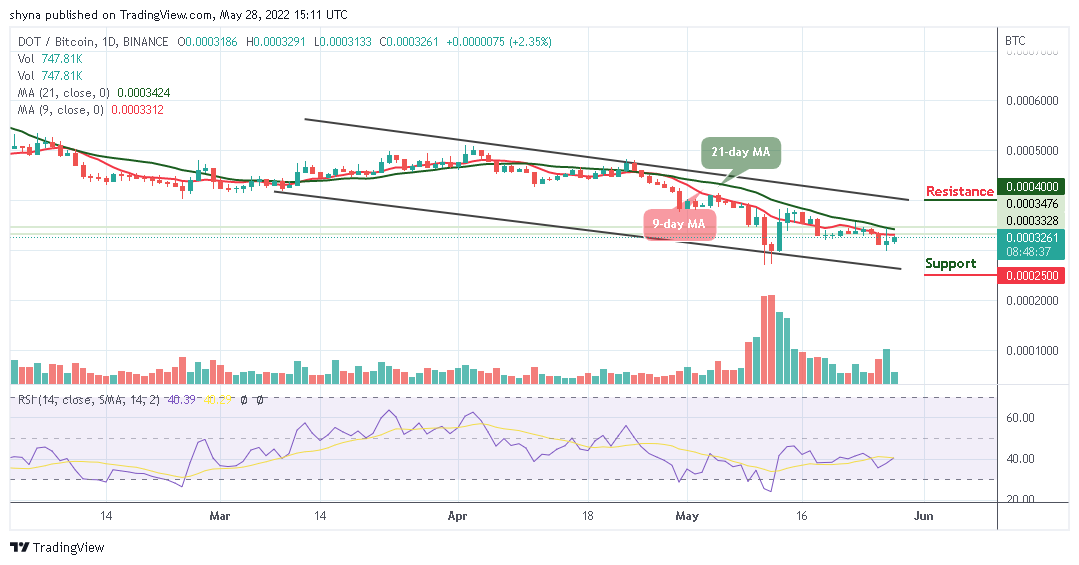 DOTBTC-Daily Chart
However, any form of retreat could bring the coin to the support level of 2500 SAT and below. But buyers will need to gather enough momentum to push the market price to the north. For now, DOT/BTC is moving sideways and may start rising once the technical indicator turns upward.
eToro – Our Recommended Crypto Platform
![]()
- ASIC, CySEC and FCA regulated – 20 million users worldwide
- Buy with Bank transfer, Credit card, Neteller, Paypal, Skrill, Sofort
- Free Demo Account, Social Trading Community
- Free Secure Wallet – Unlosable Private Key
- Staking Rewards for holding ETH, ADA or TRX
- Copytrade Winning Crypto Traders – 83.7% Average Yearly Profit
![]()
68% of retail investor accounts lose money when trading CFDs with this provider.
read more:
Comments are closed.