Neo price analysis shows a bullish signal today as the price rises to the $6.57 mark and is up by 3.15 percent in the last 24 hours. The digital currency has been trading in a tight range for the past few days, but the recent break above $6.57 could be an indication of further bullish momentum in the coming days. The bulls have been in control of the market since the beginning of today after hitting support at $6.32 and resistance at $6.58, which is likely to move upwards toward $6.6.
However, during the intraday trading session, the trading volume climbed by 7.72 percent and is now at $24,643,167. This demonstrates that the market is controlled by the buyers. Consequently, the NEO/USD pair’s market capitalization is currently trading at $463,694,717.
Neo price analysis 1-day chart: Bullish vigor increases to $6.57
The 1-day Neo price analysis shows that the NEO/USD pair is trading close to the upper boundary of an ascending parallel channel pattern that has formed on the 24-hour chart. This suggests that the bulls are in charge of the market, and if they are successful in breaking through the $6.58 resistance level, the price may rise to $6.6 in the coming hours.
NEO/USD 1-day price chart, Source: TradingView
The technical indicators confirm the bullish trend, with the Relative Strength Index (RSI) climbing above the 40 level. The moving average convergence and divergence (MACD) in the 1-day price chart is also in green, indicating bullish momentum. The 20 EMA is currently at $6.56, while the 50 EMA is at $6.47, which is also in the green, indicating that the bulls are in control of the market.
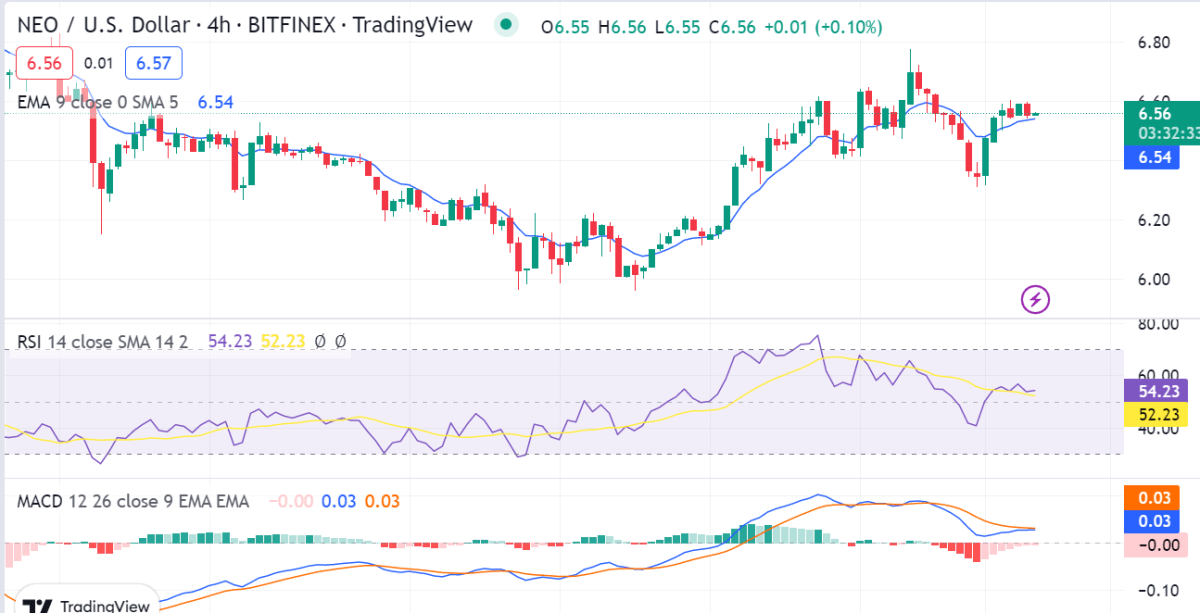
NEO/USD 4-hour price chart: Bullish momentum is still strong.
The 4-hour Neo price analysis reveals that the NEO/USD pair is trading in a tight range between $6.56 and $6.57 levels. The bulls have been in control of the market since yesterday’s opening, which could be an indication of further bullish momentum in the coming days.
 NEO/USD 4-hour price chart, Source: TradingView
The technical indicators confirm the bullish trend, with the Relative Strength Index (RSI) climbing above the 50 levels. The 20 EMA is currently at $6.56, while the 50 EMA is at $6.54, which is also in the green, indicating that the bulls are in control of the market. The MACD in the 4-hour price chart indicator indicates that the Neo price is gaining momentum as the fast-moving line crosses above the signal line.
Neo price analysis conclusion
Overall, the Neo price analysis is bullish and suggests further upside potential if the bulls can break the resistance level of $6.58 in the coming days. However, if the bears manage to break the support level of $6.32, then we could see a correction in price.


Comments are closed.