
This is an editorial opinion by Mike Ermolaev, head of public relations at the ChangeNOW exchange and a contributor for Bitcoin Magazine.
A much-awaited recovery rally has occurred for bitcoin prices after a month of consolidation around $20,000. Interestingly, this coincides with the previous cycle peak in 2017.
Short-term momentum remains favorable, while longer-term macro indicators suggest a firmer foundation may take time.
Bitcoin’s 66% decline from its all-time high has largely evicted speculators, leaving only whales and those with strong convictions to hold.
However, a recent trend has seen short-term holders flock to the $20,000 region, where ownership is being transferred from capitulating sellers to more optimistic buyers.
Source: Glassnode
At the same time, holders who have accumulated coins over the past six months refuse to liquidate their positions despite heavy unrealized losses, suggesting they are less sensitive to market fluctuations.
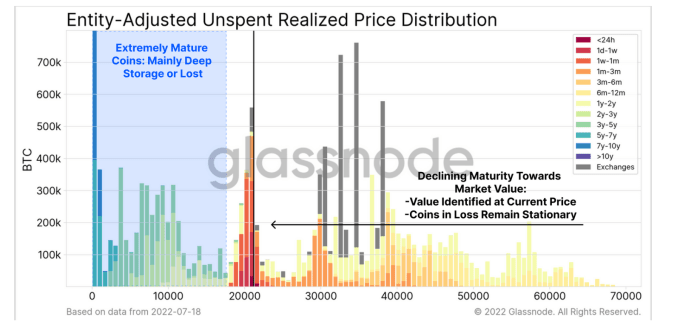
Source: Glassnode
The Mayer Multiple — a multiple of the current bitcoin price over the 200-day moving average — dropped below 0.55 at the extreme of this price correction, indicating the market traded at a 45% discount to the 200 daily moving average. Bitcoin prices have historically formed cyclical bottoms under this level, but this has been rare, occurring less than 3% of the time.
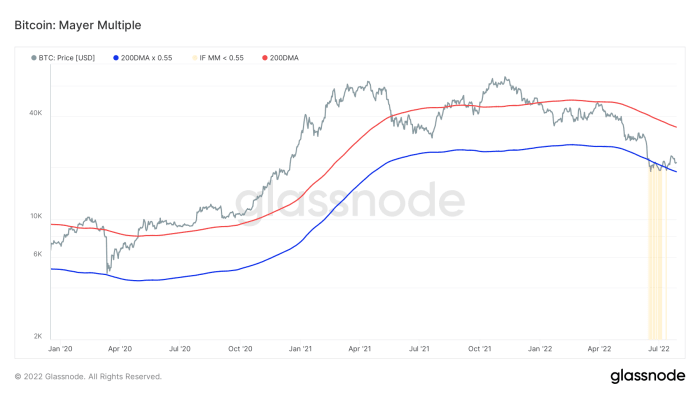
Source: Glassnode
As of right now, bitcoin appears to be eclipsing that level after having been below it for some time. This means the worst of the bitcoin bear market is likely over, if history is any guide.
There is also an interesting interaction when the cost basis for the long-term holders rises above the aggregate cost basis for the wider market (the realized price). For the long-term holders’ realized price, long-term holders need to either purchase coins above their cost basis or wait until coins with higher cost bases mature beyond the 155-day mark. This is rare during a bear market.
The realized price climbs above the long-term holders’ realized price in times of market bottoms, sustained strength and sufficient demand to offset profit-taking. Historically, bear market low divergences have lasted between 248 days and 575 days. A period of 17 days has been in effect for the current cycle, a comparatively short time frame.
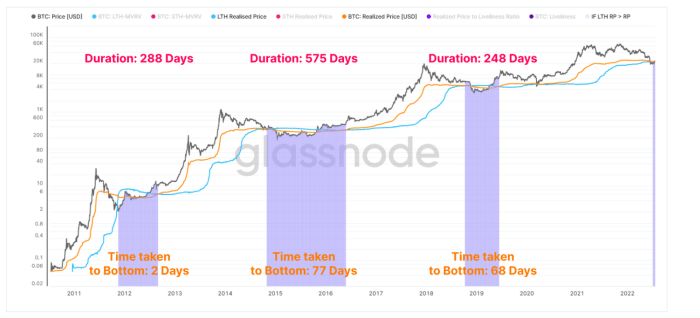
Source: Glassnode
BTC Price Is Determined By Macro
Although we wanted bitcoin to be independent from traditional markets and macroeconomic indicators, this is not the case right now. With the entry of major institutional players and their vast amounts of liquidity, this dependence has intensified. Therefore, the behavior of digital assets is influenced by global liquidity flows.
This is why M2 money supply, which includes physical cash, deposits and less liquid money including bank savings accounts, can be a leading indicator of bitcoin’s price movement.
Moreover, as we can often see at ChangeNOW, the S&P 500 and bitcoin prices are closely correlated. From a larger perspective, the S&P is driven by the consolidated balance sheets of major central banks. In general, a rising S&P 500 is associated with expanding central bank balance sheets and the same is true for bitcoin.
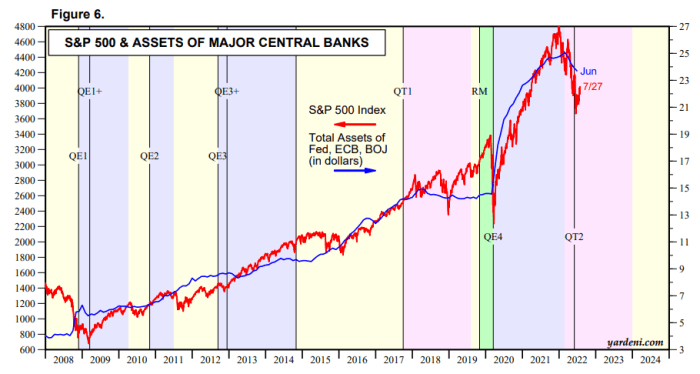
Source: Yardeni.com
So, you can get a sense of bitcoin’s future by monitoring the aggregated central banks’ balance sheets chart.
bottom line
In analyzing bitcoin’s on-chain activity, we at ChangeNOW can see that long-term holders, who are less affected by bitcoin price volatility, never left the market, while short-term speculators escaped during the recent sell-off, allowing more optimistic buyers to enter. Meanwhile, as we look at global liquidity flows originating from major central banks, we can get a sense of what is going on with bitcoin’s price, as well as what is to come in the near future. It doesn’t matter whether you’re a strong long-term bull, a capitulating seller, a fresh buyer or just watching from afar, we all need to understand the logical side of this seemingly chaotic bitcoin market.
This is a guest post by Mike Ermolaev. Opinions expressed are entirely their own and do not necessarily reflect those of BTC Inc. or Bitcoin Magazine.
Comments are closed.