
A look at the Bitcoin transactions and accumulation among various groups using the Accumulation Trend Score (ATS) shows that this is the third most aggressive dumping by Bitcoin (BTC) whales in history.
The accumulation trend score is a metric that gauges the behavior of various wallet cohorts. It measures the relative strength of accumulation for each entity by looking at the size of the entities and how much they have acquired or sold in the last 15 days.
Where the value is close to 1, it indicates that the entity is accumulating, and when it is close to 0, it means the group is distributing. For Bitcoin, the metric excludes miners and exchanges from that group, focusing on whales and shrimps.
According to the ATS, whales, ie, those with more than 1000 Bitcoin in their wallet, have been the net sellers in recent times and for most of 2022. However, shrimps, ie, wallets with 1 Bitcoin or less, have been quite active regarding accumulation.
Bitcoin Accumulation Trend Score (Source: Glassnode)
The chart shows that while whales account for most Bitcoin purchases since inception, their acquisition rate has declined and is currently at its lowest.
The whales’ net position change chart identifies the 30-day net position change of whales buying and selling BTC. Green denotes that whales are buying and that behavior has trended downward since BTC’s inception.
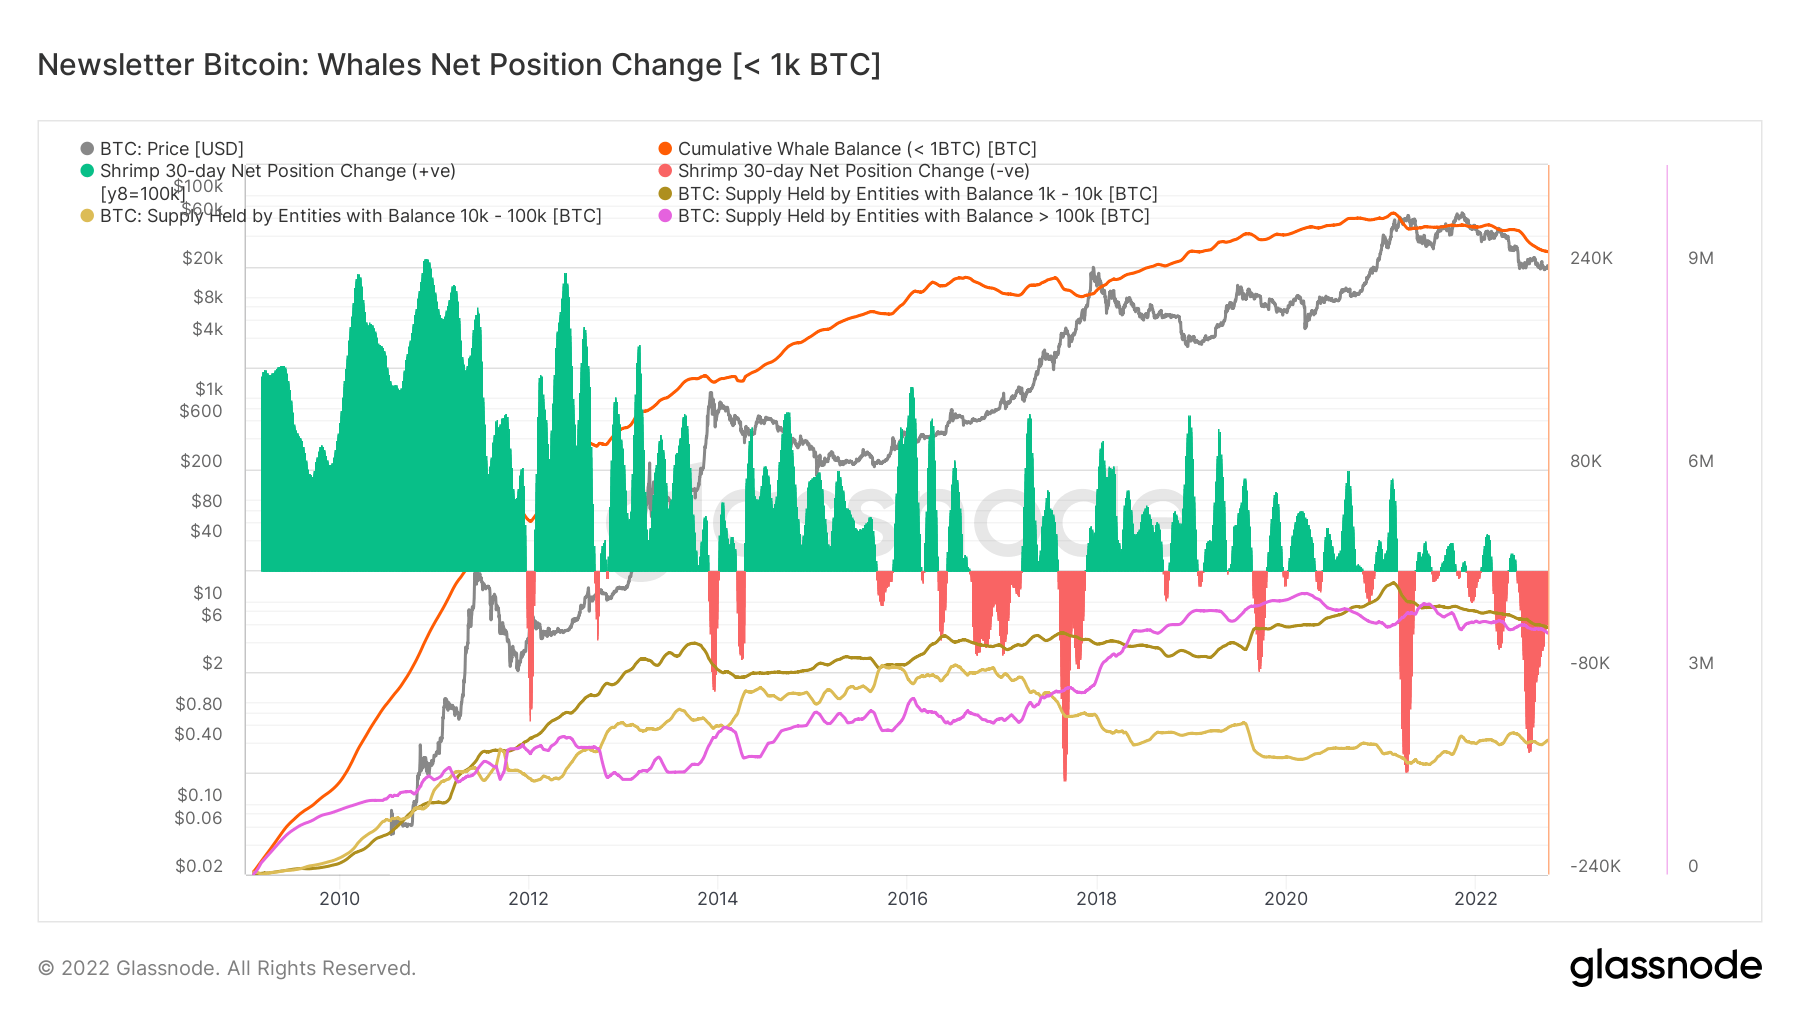 Bitcoin Whales Net Position Change (Source: Glassnode)
By comparison, the rate of distribution is at its third highest. In two cases of the 2017 and 2021 bull run, whales were selling for profit. But the 2022 distribution is due to a decline in prices.
Whales are now selling to hedge their losses. This means they are taking advantage of any positive turn in the market to offload the digital asset.
Although not all whales are selling, a few whales, such as Microstrategy, are accumulating. But the fact that most of the whales are selling does not bode well for BTC in the short term.
However, the shrimp are still accumulating, and a new group of short-term hodlers is forming. With the price range mostly between $17,000 and $22,000, most small hodlers are taking advantage to increase their holdings.
The fact that most new hodlers have unrealized losses suggests they will not sell anytime soon.
Posted In: Bitcoin, Research
Did Edge on the Crypto Market 👇
Become a member of CryptoSlate Edge and access our exclusive Discord community, more exclusive content and analysis.
On chain analysis
Price snapshots
More context
Join now for $19/month Explore all benefits
Comments are closed.